Dashboard
The Agent Receipts Dashboard is a lightweight, read-only web UI for browsing receipt databases produced by any Agent Receipts SDK or the MCP proxy. It ships as a single Go binary with no external runtime dependencies.
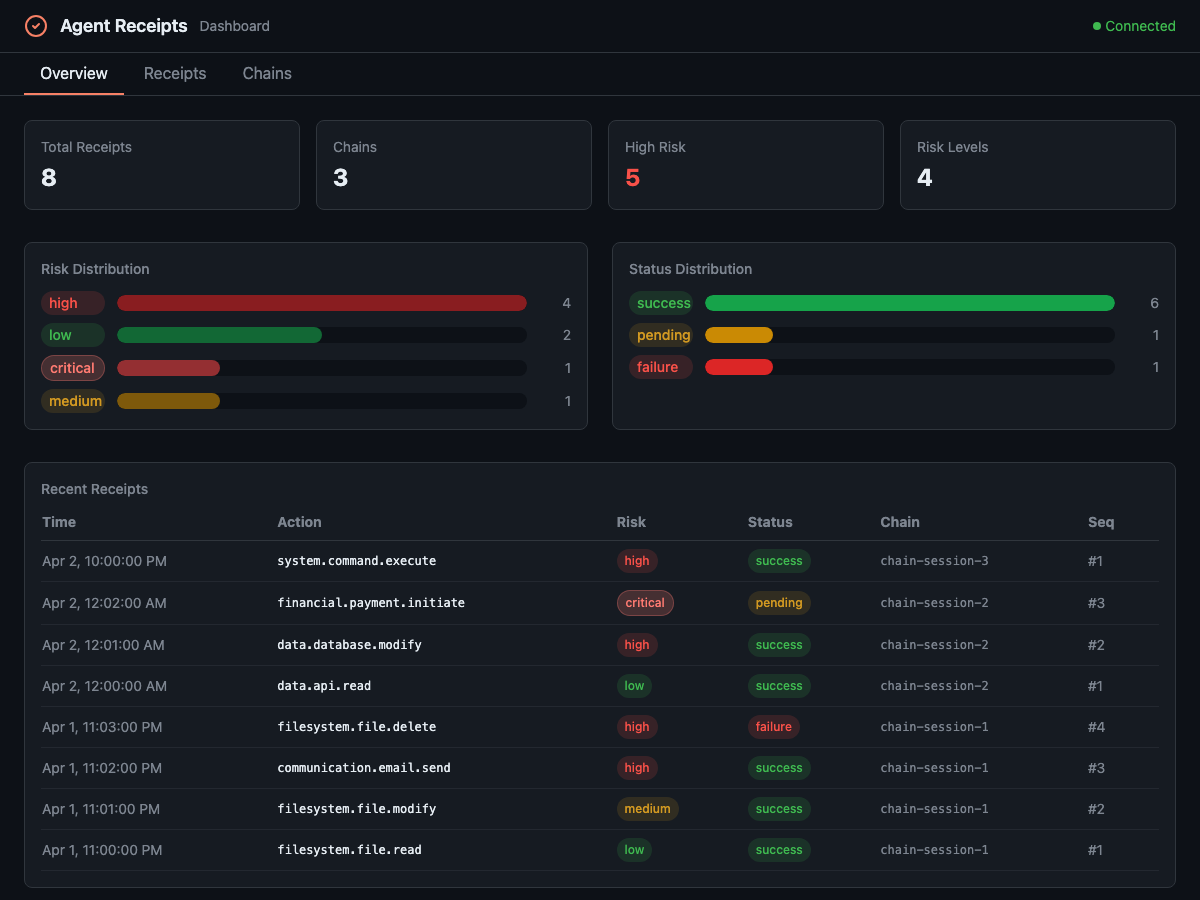
Repository: agent-receipts/dashboard — the README is the canonical reference for the full feature set, CLI flags, and HTTP API. This page is a conceptual overview.
What you can do
Section titled “What you can do”- Browse & filter receipts — by action type, risk level, status, time range, chain, server/tool, session, or free-text search, with deep-linkable URLs.
- Inspect analytics — activity timeline, error-rate and throughput trends, action distribution, and per-server/tool breakdowns, all scoped to a time-range picker (1h · 6h · 24h · 7d · 30d · All).
- Verify chains — hash linkage and sequence ordering, plus Ed25519 signatures when you supply a public key.
- Decrypt parameter previews — when a forensic key is loaded, the dashboard decrypts HPKE-encrypted disclosures inline so you can see the real tool inputs and outputs.
- See multi-agent attribution — for multi-agent sessions, a delegation graph with cross-agent file dependencies, blast-radius, and risk rings.
- Export — full raw JSON for any receipt, one-click export of a receipt or a whole chain.
| Tab | What it shows |
|---|---|
| Overview | Stats, activity timeline, risk/status/action distribution, error-rate — scoped by a time-range picker |
| Receipts | Filterable receipt list with free-text search, session/chain/server/risk filters, and deep-linkable URLs |
| Actions | Top actions by failure rate with per-action breakdown |
| Servers | Per-server/tool breakdown with mini failure-rate bars |
| Sessions | Agent sessions list; click through to the session attribution graph |
| Chains | Chain list with verification controls |
Verifying chains
Section titled “Verifying chains”Clicking Verify on a chain runs one of two modes:
Without a public key — structural only Checks hash linkage and sequence ordering. A green result means the receipts link and are correctly ordered; signatures are not checked.
With a public key — full cryptographic
Paste your Ed25519 public key in PEM format beside the Verify button. The dashboard passes the key to /api/chains/:id/verify, which validates each receipt’s Ed25519 signature. Each receipt carries a signature_valid field shown as a Sig ✓/✗ badge.
Verification recomputes each receipt’s canonical hash from the verbatim bytes stored in the database, so a chain that obsigna receipt verify accepts verifies in the dashboard too.
Session attribution
Section titled “Session attribution”When a session involves multiple agents, the dashboard builds a provable dependency graph from action.target.resource paths in the receipts (requires obsigna hook v0.19.0+).
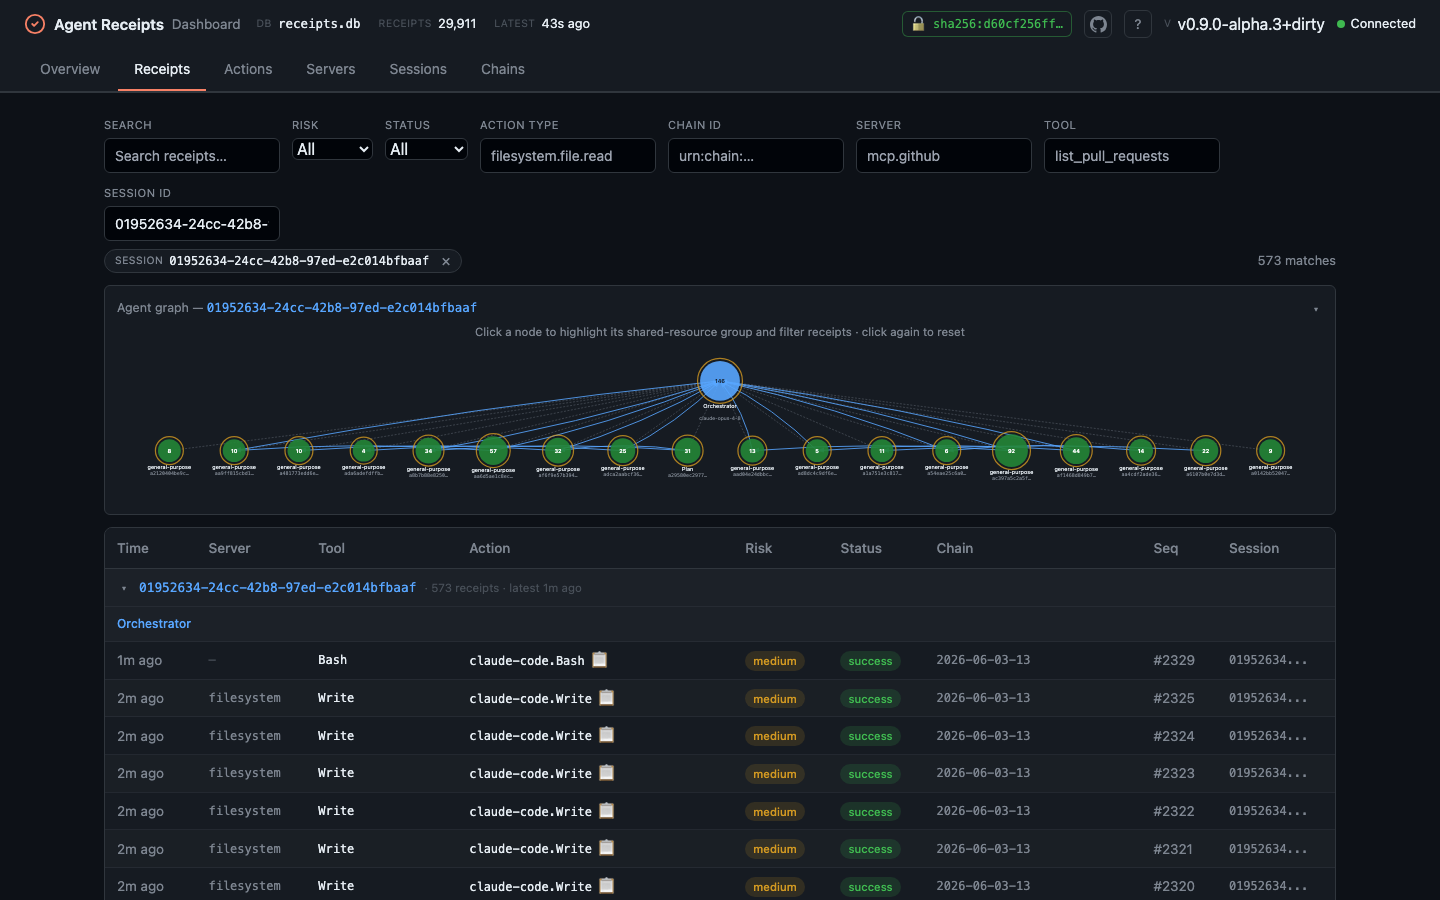
- Delegation edges (dashed gray) — which agent spawned which.
- State-dependency edges (solid blue arrows) — two agents touched the same file; the arrow shows causal order.
- Risk rings — orange (medium) or red (critical) outer rings on nodes with elevated-risk receipts.
- Blast-radius panel — click any node to see which files it touched, which other agents share a state dependency on those files, and a heuristic co-turn coupling count when agents operated on the same resource in overlapping time windows.
A N / M receipts identity-indexed indicator shows how complete the picture is. Receipts without a target.resource (Bash, MCP, spawn) are counted but cannot contribute to file-identity edges.
Forensic decryption
Section titled “Forensic decryption”If your receipts carry HPKE-encrypted parameter disclosures (the daemon’s parameter-disclosure mode), the dashboard can decrypt them inline to preview the real tool inputs and outputs — the private key never leaves the machine.
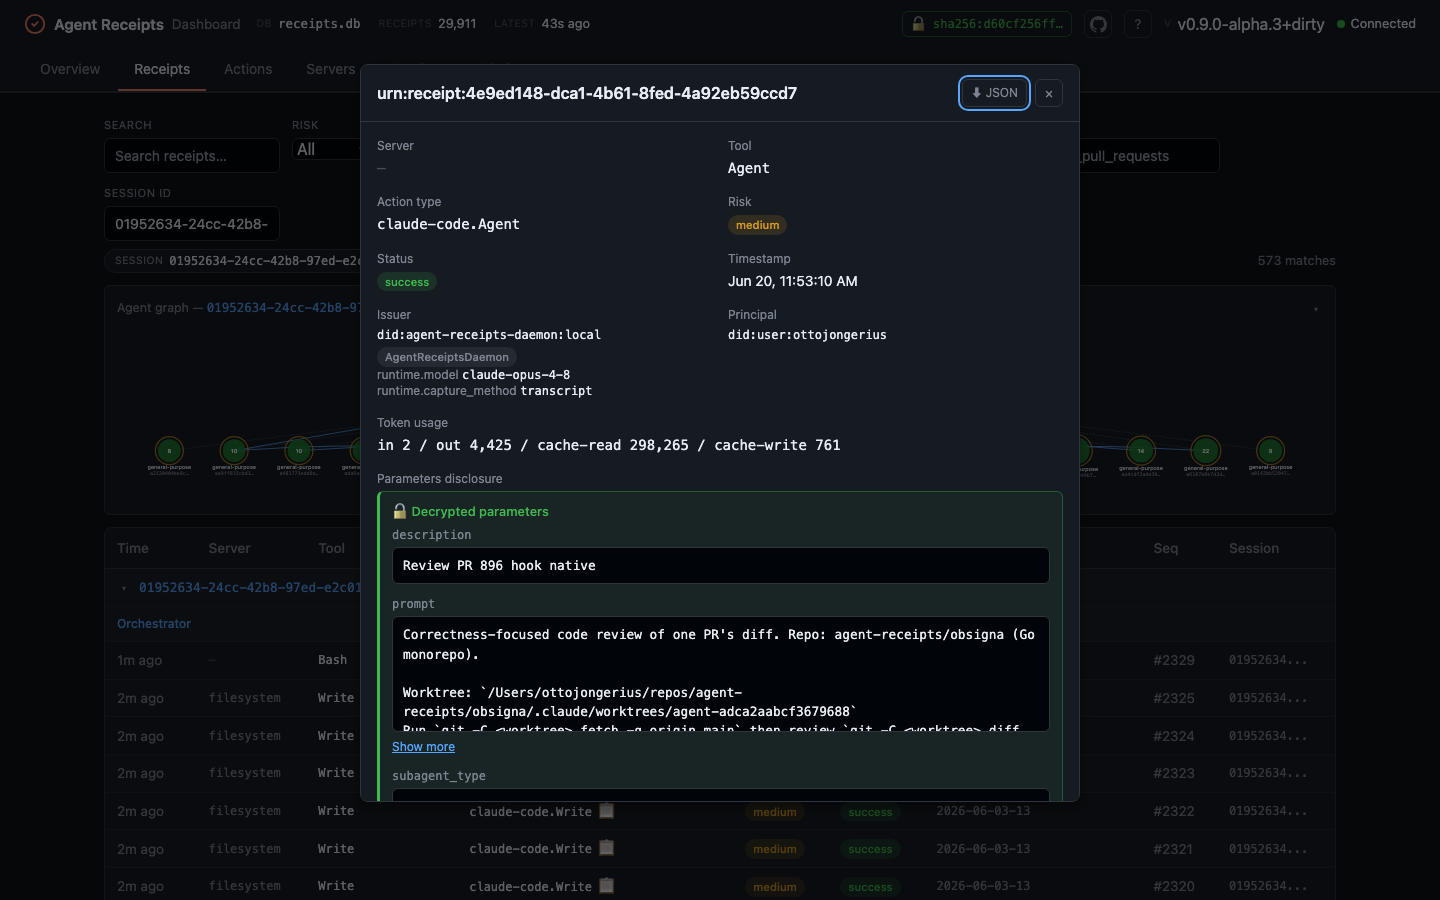
When bound to a loopback address and a key exists at ~/.local/share/agent-receipts/forensic.key, it loads automatically and previews are decrypted on the fly. The key’s sha256: fingerprint is shown in the header; receipts encrypted to a different key surface a “key mismatch” state rather than failing silently. You can also load a key manually from the UI.
Because this is the one feature that touches key material, the forensic endpoints are loopback-only and guarded against DNS-rebinding and cross-origin requests.
See the dashboard README for accepted key formats and the full security model.
How it works
Section titled “How it works”The dashboard opens your SQLite receipt database in read-only mode and serves a web UI at localhost. It never modifies your data. All three SDKs and the MCP proxy use an identical SQLite schema, so the dashboard reads from any of them.
See Installation to get started.